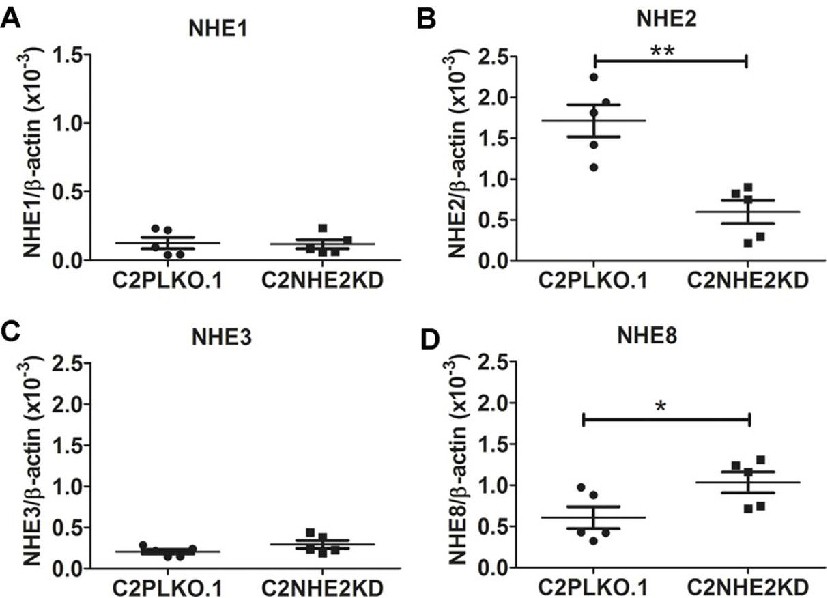
Fig. 4. mRNA expression of NHE1-3 and NHE8 in 14 day-differentiated, filter-grown Caco-2BBe, C2PLKO.1 and C2NHE2KD cells. Comparisons of (A) NHE1, (B) NHE2, (C) NHE3 and (D) NHE8 mRNA expression levels between C2PLKO.1 and C2NHE2KD cells using β-actin as control gene. (n=5, mean ± SEM, unpaired student t-test, *p<0.05, **p< 0.01).